Quant intraday signals
Systematic intraday entries from the strategy research already running on real money, published the same way the level signals are: entry only, with the evidence attached.
BTC · live
Levelflow publishes Bitcoin entry signals: the level, an alert while price is still on its way to it, and how far price has typically gone against you from there. On a TIGHT signal the median worst move against the entry, in the 15 minutes after it fires, has been 20.0 bp (0.20%). When it is WIDE, it has been 24.9 bp (0.25%).
No cherry-picked wins and no quiet deletions. Every signal is written to the journal as it fires, scored an hour later, and stays there — the losses with the rest.
Right now
Calm tape — small move against you expected.
0.20%
256 touches · 2026-07-23..2026-10-16
Confirms conditions, not direction.
What each grade has been worth
| Grade | Median adverse move @15m | vs baseline | Held ≤20 bp | Touches | Window |
|---|---|---|---|---|---|
| TIGHT | 20.0 bp 0.20% | -3.3 bp | 50.0% | 256 | 2026-07-23 → 2026-10-16 |
| NORMAL | 25.6 bp 0.26% | +2.3 bp | 41.9% | 260 | 2026-07-24 → 2026-10-16 |
| WIDE | 24.9 bp 0.25% | +1.6 bp | 42.9% | 310 | 2026-07-27 → 2026-10-15 |
| ALL TOUCHES | 23.3 bp 0.23% | — | 45.5% | 844 | 2026-07-23 → 2026-10-16 |
The grade is the edge. A TIGHT read has cut the typical move against the entry by 14% against the ALL TOUCHES row — which is what a touch does when you know nothing about the tape. A grade is worth exactly the distance between its row and that one, and no more.
Available now
You are alerted while price is still on its way to the level, so you have time to decide rather than react. Every alert carries the level, the side price arrived from, and the move to expect against the entry — in Telegram or your own webhook, as it happens.
Top 4% of 257 TIGHT signals
Top 4% of 261 NORMAL signals
Top 59% of 310 WIDE signals
Top 2% of 257 TIGHT signals
Recorded signals, out-of-sample. The line is the published level, the dot is the moment the alert fired. See the full record.
Available now · Pro Quant
The first hour of the US session sets a high and a low. The minute it closes, we publish the odds that each one survives to the close, and the level each side is most likely to reach, straight onto your chart.
Called at 80% or more to hold, the first-hour extreme has held 86% of the time, across 145 calls.
Top 3% of 250 recent weekday sessions
Available now · Pro Quant
Two resistance lines, read live from the options market and redrawn as positioning shifts: a primary line that price tends to react to within the half hour, and a secondary line that works over the hours after.
After a first touch of the primary line, price has been lower 30 minutes later 64% of the time, across 111 touches. At any minute of the same days: 50%.
Top 6% of 111 first touches of this line
In the lab
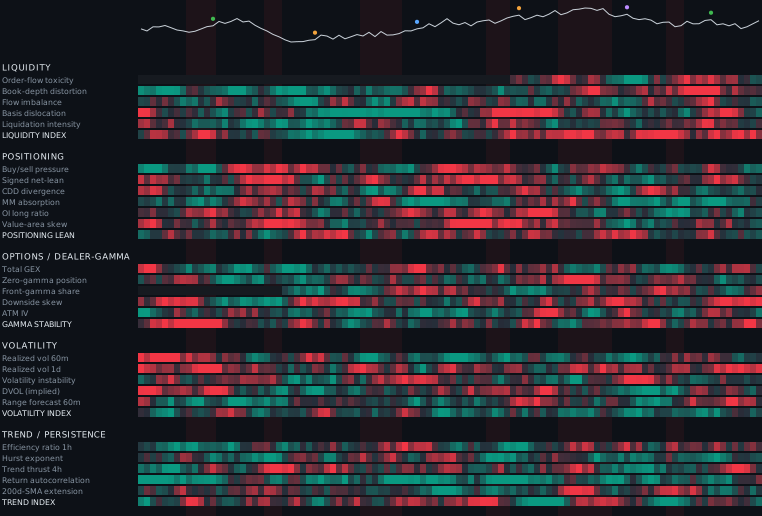
One screen for the state of the tape. Every input we already compute — liquidity, positioning, dealer gamma, volatility and trend — reads as a single strip through time, so you can see whether the last hour is ordinary for this market or nothing like it.
It runs internally today. Like everything else here it ships only once it has a forward record of its own.
In the lab
Each of these is real research we already run internally. None of them ship until they have a forward record, because that is the only thing we sell.
Systematic intraday entries from the strategy research already running on real money, published the same way the level signals are: entry only, with the evidence attached.
The free plan carries the live grade on every touch. No card, no call — just an email address, and the same journal you have been reading.